 Next: A in [0.404, 0.474]
 Next: A in [0.404, 0.474]
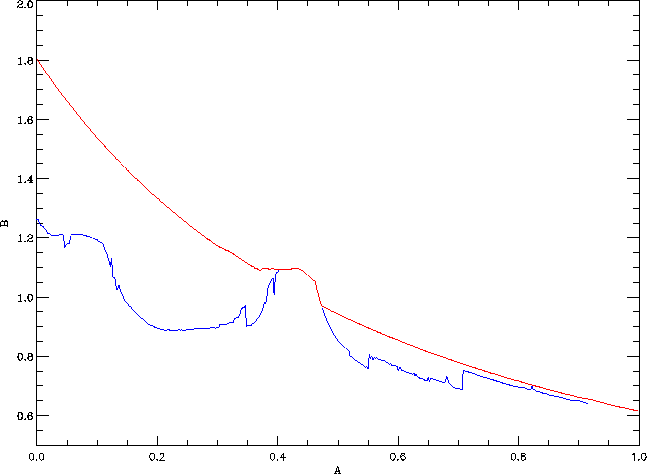
Figure 1 shows the bifurcation
diagram of the quasiperiodically forced Hénon map with
c = 0.1. The Parameter A is on the horizontal, and
b is on the vertical axis. Crossing the blue curve as
b increases is a transition from a nonchaotic to a chaotic
attractor. Note that the transition from a nonchaotic to a chaotic
attractor is actually not a curve. The blue curve shows the
first transition. Crossing the red curve as b
increases is a boundary crisis where the attractor disappears.

|
|
|
We concentrate on the part where the red curve has an interesting bubble, namely the part where A runs from 0.3 to 0.5 and b runs from 0.8 to 1.2; see Figure 2. Numerical evidence shows that for A-values in [0.37, 0.474] the boundary crisis does not happen simultaneously with the homoclinic tangency of the stable manifold that is the basin boundary of the attractor and the unstable manifold that acccumulates on the attractor. This is namely the case for all other A-values; see for example the animations of earlier computations.
|
A in [0.404, 0.474]A in [0.37, 0.404] |
Approximately for A in between 0.404 and 0.474, there is no transition from a nonchaotic to a chaotic attractor; the attractor disappears while it is still nonchaotic. Approximately for A in between 0.37 and 0.404, the attractor becomes chaotic before it disappears in the boundary crisis. In both cases, the homoclinic tangency of the manifolds of the invariant circle on the basin boundary does not cause the disappearance of the attractor. Hence, the invariant manifolds that are involved in the boundary crisis can change due to the quasiperiodic forcing.
 Next: A in [0.404, 0.474]